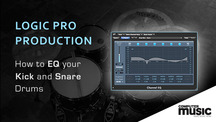
Loopmasters show this great tutorial on how to EQ your kick and snare drums for power, weight and presence from the Computer Music Logic Pro Tutorials archive.
Computer Music is one of the world’s best-selling music software magazine with easy-to-follow tutorials for all sorts of music software, unbiased reviews of latest products, and answers to technical questions.
Using the Logic Channel EQ
The way you use the Channel EQ is obviously dependent on the audio material and what you intend to do with it, but a useful workflow for many situations is as follows: Set the Channel EQ to a flat response (no frequencies boosted or cut), turn on the Analyzer and play the audio signal. Keep an eye on the graphic display to see which parts of the frequency spectrum have frequent peaks and which parts of the spectrum stay at a low level. Pay particular attention to sections where the signal distorts or clips. Use the graphic display or parameter controls to adjust the frequency bands as desired.
You can reduce or eliminate unwanted frequencies, and you can raise quieter frequencies to make them more pronounced. You can adjust the center frequencies of bands 2 through 7 to affect a specific frequency—either one you want to emphasize, such as the root note of the music, or one you want to eliminate, such as hum or other noise. While doing so, change the Q parameter(s) so that only a narrow range of frequencies are affected, or widen it to alter a broad area.
Each EQ band has a different color in the graphic display. You can graphically adjust the frequency of a band by dragging horizontally. Drag vertically to adjust the amount of gain for the band. For bands 1 and 8, the slope values can be changed only in the parameter area below the graphic display. Each band has a pivot point (a small circle on the curve) at the location of the band’s frequency; you can adjust the Q or width of the band by dragging the pivot point vertically.
You can also adjust the decibel scale of the graphic display by vertically dragging either the left or right edge of the display, where the dB scale is shown, when the Analyzer is not active. When the Analyzer is active, dragging the left edge adjusts the linear dB scale, and dragging the right edge adjusts the Analyzer dB scale.
To increase the resolution of the EQ curve display in the most interesting area around the zero line, drag the dB scale, on the left side of the graphic display, upward. Drag downward to decrease the resolution.
Using the Logic Channel EQ Analyzer
The Analyzer, when active, makes uses of a mathematical process called a Fast Fourier Transform (FFT) to provide a real-time curve of all frequency components in the incoming signal. This is superimposed over any EQ curves you have set. The Analyzer curve uses the same scale as the EQ curves, making it easy to recognize important frequencies in the incoming audio. This also simplifies the task of setting EQ curves to raise or lower the levels of frequencies/frequency ranges.
The bands derived from FFT analysis are divided in a logarithmic scale—there are more bands in higher octaves than in lower ones.
As soon as the Analyzer is activated, you can change the scaling with the Analyzer Top parameter, on the right side of the graphic display. The visible area represents a dynamic range of 60 dB. Drag vertically to set the maximum value to anywhere between +20 dB and −80 dB. The Analyzer display is always dB-linear.
Note: When choosing a resolution, be aware that higher resolutions require significantly more processing power. High resolution is necessary when trying to obtain accurate analysis of very low bass frequencies, for example. It is recommended that you disable the Analyzer or close the Channel EQ window after setting the appropriate EQ parameters. This will free up CPU resources for other tasks.
Enjoy!